For new Salesforce users, sales reporting can feel overwhelming at first—but once you learn the basics, reports become one of the most valuable tools for forecasting, pipeline visibility, and revenue growth. If you’re unsure where to start, begin with what matters most: clarity.
The best first step is to build a Leads and Opportunities Overview Report. Start by selecting the Opportunities report type, filter by stage, and group results by Owner or Close Date. This instantly gives sales managers a snapshot of who is closing, when revenue is coming in, and where deals are getting stuck.
Next, experiment with summarizing data. Add totals for Expected Revenue, Amount, and Close Probability. This transforms raw data into a readable performance dashboard. From there, try a Pipeline by Stage Report, allowing you to identify which stages are overloaded or slowing progress—critical insight for team coaching and forecasting.
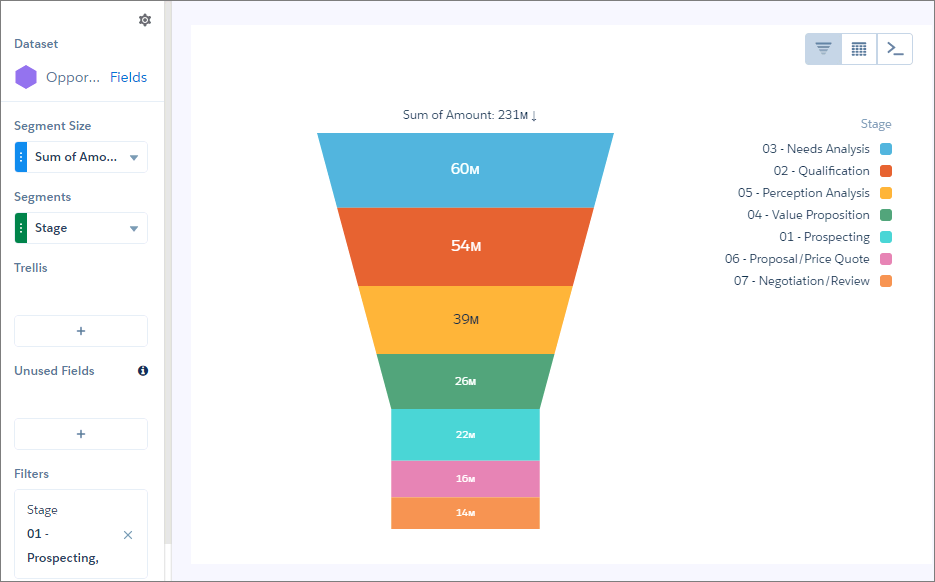
Finally, turn your report into visual power by adding charts inside the report and dashboards. A stacked bar chart by stage or funnel visualization makes trends pop at a glance.
Sales reporting isn’t just about numbers—it’s about empowering better decision-making. With just a few core reports, teams gain insight into pipeline health, forecast accuracy, and sales activity trends. Once the basics are mastered, Salesforce reporting becomes a growth engine.
Learn more about creating a funnel chart in Salesforce: https://help.salesforce.com/s/articleView?id=analytics.bi_chart_intro_funnel.htm&type=5